


×
Author Note – This unique article quanitifies the impact of gas price on demand in the power sector, and also integrates analysis of power demand, LNG and Russian flows to forecast an overall market balance for gas. It reflects analysis which was conducted in October. An update will be made in January 2020, when it will be known whether there is a disruption to Russian-Ukraine flows – the key event that will define the market.
The past year has seen exceptional turbulence in EU gas markets. From a high of 28€/MWh in September 2018, the benchmark TTF quote collapsed to 10€/MWh in June 2019, and EU gas storage has reached unprecedented levels, as large volumes of LNG have entered the market. Despite this collapse, TTF has spent most of this year in strong contango and as of mid October 2019 trades at 18€/MWh in early 2020. The Power sector has traditionally been a key driver for setting prices in the European gas market. Demand for gas in non-power sectors (space heating, industry) is price inelastic in the short term, but in the power sector, gas competes with coal for fossil-based generation demand. This gas on coal competition is strongly price sensitive and was a major factor in rebalancing the gas market in the previous market downturn during the 2009-2010 economic crisis.
This report:
* This research will be available on –
https://www.oxfordenergy.org/publications/?v=79cba1185463
Note, this report will be of interest to:
In the European power market, coal and gas (and in some markets lignite) compete for the available power demand left over once output from renewables and nuclear has been placed. The competition between coal and gas is driven mostly by the variable cost of production of each – the costs of gas, coal, and CO2 emissions credits.
The charts below show the relationship between TTF and the % share of gas in the fossil fuel mix over the 12 month period from Sept 18 to Aug 19. As can be seen, gas’ share of fossil fuel generation is highly dependent upon gas price. Statistical analysis confirmed that for most major markets this correlation is strong, and that gas’ share of fossil fuel generation correlated specifically to TTF, the main European gas price marker. Only in the less well connected markets of Eastern Europe (e.g. Poland, Romania) was the correlation weaker.
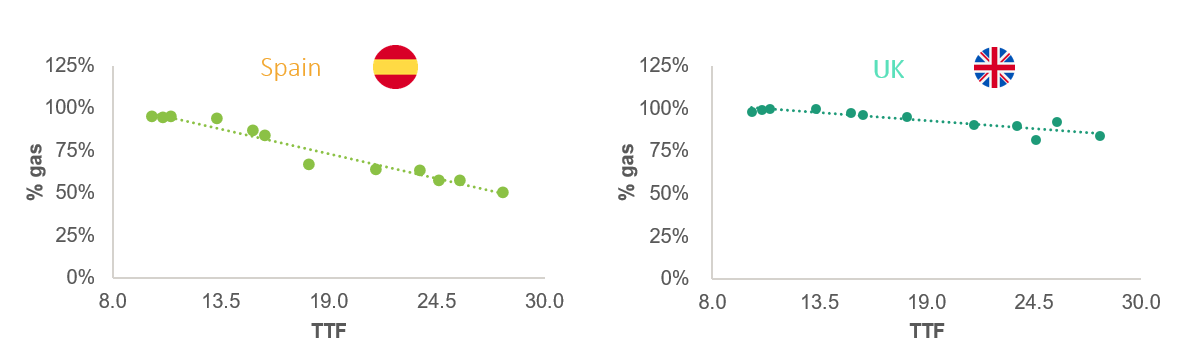
In those markets where gas’ share of the market was small in 2018, gas usage has increased substantially – Spain is a good example. In contrast, for markets like the UK and France gas’ share of the fossil fuel generation mix was already high in mid-2018. Although lower gas prices have increased this share further, the increase in gas demand has been smaller.
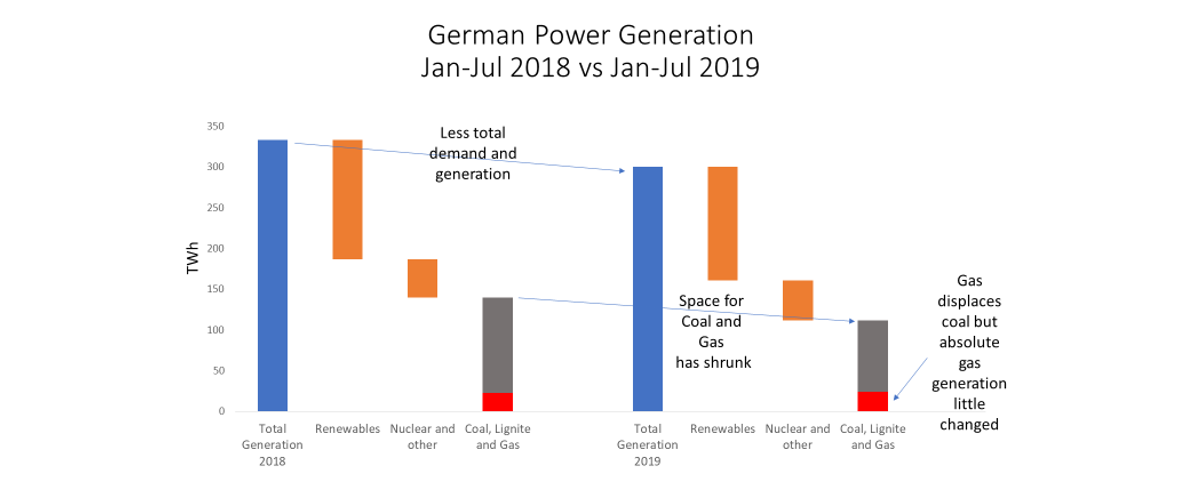
The German market merits separate discussion due to its size and great potential for displacement of coal.

Over Sept-2018 to Aug-2019, there was limited displacement of lignite-based fossil generation. Displacement of coal by gas was much more significant, but unlike Spain, Italy, the UK or France gas did not completely displace coal and coal’s share of the gas + coal generation mix remained at 40%. This is largely due to Germany having significant amounts of combined heat and power generation, which continues to run if there is demand for heat, irrespective of the margin for electricity generation.
This displacement of coal by gas would be expected to lead to much higher absolute gas consumption for power in Germany. However, for the first half of 2019 this has not entirely been the case due to other important drivers or demand that are discussed later.
The section above shows that gas’ share of fossil fuel generation has increased strongly in most European markets. However, in many markets, the total amount of generation from fossil sources has changed considerably from 2018 to 2019 and this has either magnified or cancelled out the impact of lower gas prices. In Germany, total power generation has been falling with the contraction of industrial output; since generation from renewables and nuclear has remained roughly constant, generation from fossil fuels has been squeezed. Although gas has increased its share of the fossil fuel mix, fossil fuels’ share of total generation has dropped, leaving absolute gas consumption only slightly higher.
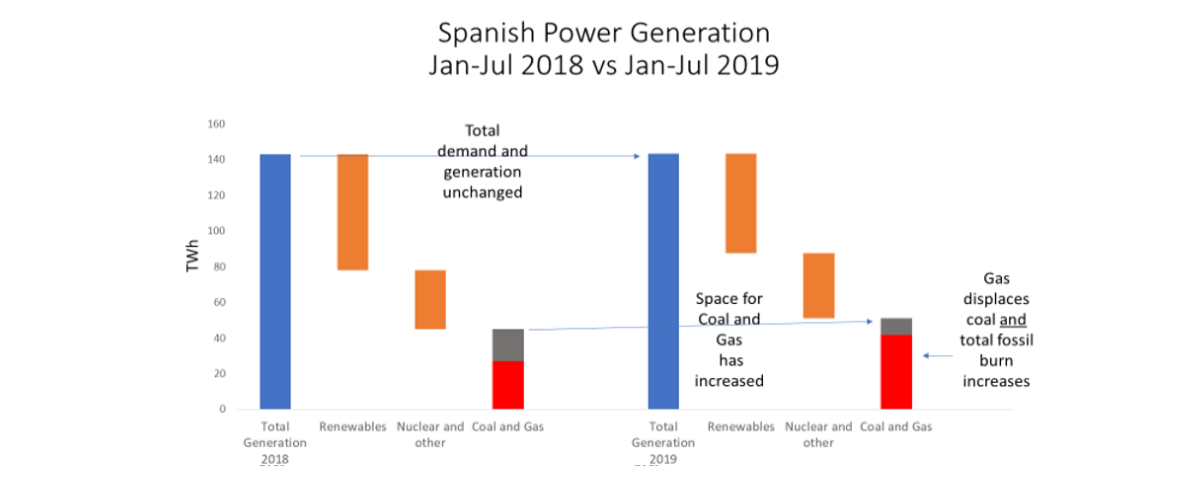
Spain in contrast shows a much more positive picture for gas. Renewables power generation in H1 2019 fell due to lower generation from hydro, meaning that total demand for fossil fuels increased. Since the share of gas has also greatly increased, absolute gas demand has grown even more strongly.

An analysis of total power demand and generation from renewables was done to complete the analysis of gas demand. The table below shows the forecast increase in gas demand in 2019 vs 2018, taking into account gas price, total power demand, and total nuclear and renewables generation. Increased demand is forecast as roughly 20bcm. Nearly all of this is price-driven, since non-price factors have largely cancelled each other out in 2019 at an overall EU level (but have been very significant at country level).
| Market | Forecast Incremental Gas Demand 2019 vs 2018 bcmf | Comments |
| Germany | 2.0 | Decrease in total power generation partially offsets increased competitiveness of gas vs coal. |
| Italy | 3.4 | Increase in gas’ share of fossil fuel market. |
| UK | 0.1 | Decrease in total power generation offsets increased competitiveness of gas vs coal. |
| Spain | 7.5 | Lower hydro output in H1 2019 led to increased fossil fuel demand. |
| France | 2.0 | Some displacement of coal and increased fossil generation due to lower hydro output. |
| Netherlands | 2.5 – 4.2 | Estimated, accurate monthly data not available; displacement of coal. |
| Poland | 0.5 | Limited displacement of coal. |
| Other Markets Studied | 1.9 | Romania, Czech Republic, Belgium, Portugal. |
| Total | 18.8 – 20.4 | For markets covering 81% of 2018 gas demand. |
Looking forward to the next few years, there are several factors that will affect demand for gas in the power sector. These are described here and their magnitude estimated in the table below.
*THE PRICE OF GAS: As of mid October 2019, the TTF forward curve shows a strong contango at the end of 2019 and into 2020. If this reflects the final outcome in the gas market in 2020, some of the 20bcm extra demand generated by lower gas prices will disappear. Using the statistical results obtained by the work described earlier, it is possible to predict gas demand for any market for any given price of gas.
THE DEMAND FOR FOSSIL FUELS: Now that gas has largely displaced coal in many EU power markets, any changes that influence total fossil fuel demand will directly impact demand for gas.
Looking forward, these include:
↑ Closure of Nuclear capacity – From 2019 to 2022, all German nuclear capacity will shut down. Belgium and Spain also have plans to close nuclear capacity (by 2025 and 2030 respectively).
↑ Phasing out of Coal Generation Capacity – Germany’s Coal Commission this year proposed a phasing out of coal and lignite capacity by 2038, with interim targets in 2023 and in 2030. In the author’s view, the impact of this in 2020-2022 will be small, since the first capacity to close will be that which is already not running frequently.
– Output from existing Renewables capacity – Renewables production is very variable, although on an annual basis the variation is smaller than generally perceived, and there is some evidence that wind and solar generation are negatively correlated.
↓ Total Demand for Power – The contraction of Europe’s industrial activity is a negative factor for gas demand in 2020.
↓ New Renewables capacity – All EU countries are committed to increase the share of renewables in their energy mix. As renewables output increases, fossil fuels generation will be squeezed out of the market.
Each of these drivers of gas demand in the power sector has been studied and quantified. The table below shows the possible impacts on gas demand relative to 2019 levels. As can be seen, the range of uncertainty for gas demand in the power sector is high and there is more downside than upside for gas in the next 3 years.
| Factor | Possible Impact on Gas Demand,relative to 2019 bcm pa | Comments |
| Gas Price Recovers | Up to -20bcm if gas price returns to mid 2018 levels | The current forward curve suggests that some demand destruction will occur. |
| Increase or Decrease in overall power demand | +/- 6 per % total power output | Demand is falling in some key markets such as Germany. |
| Increase or Decrease in Renewables Output from Existing Capacity | +/- 11-12 | Estimated for hydro, solar and wind based on statistical analysis of historical output variability. |
| New Renewables Capacity | -5 over 2019, further -5 in 2020 | Based on Agora Institute Forecast; IEA forecast lower, Wind and Solar Industry Associations higher, large range of uncertainty. |
| Nuclear phase-out in Germany | +2 at end 2019, further +6 at end 2021 and further +6 at end 2022 | Based on published plans of owners of this capacity. |
| Closure of lignite generation in Germany | Limited in up to end 2022 | Significant factor from 2023 onwards. |
The impact of demand for gas in the power sector needs to be seen in the broader context of the supply/demand balance of European gas market as a whole. The turbulence of gas pricing in 2019 has been driven by the fundamental changes in LNG Imports, European Gas Production and Russian Gas Imports as well as the changes in the power market just described before. Each of these could form a separate topic for a whole report, but a summary of each is given below.
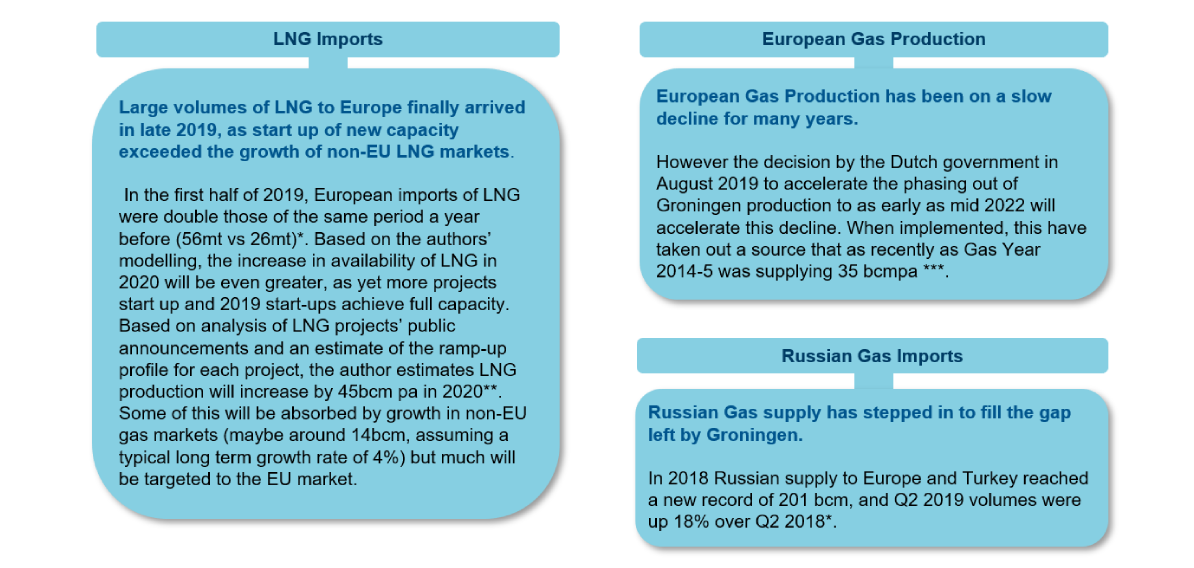
Sources: * Data from DG Energy, EU Commission;
** Author’s unpublished analysis;
*** Reuters, NAM website
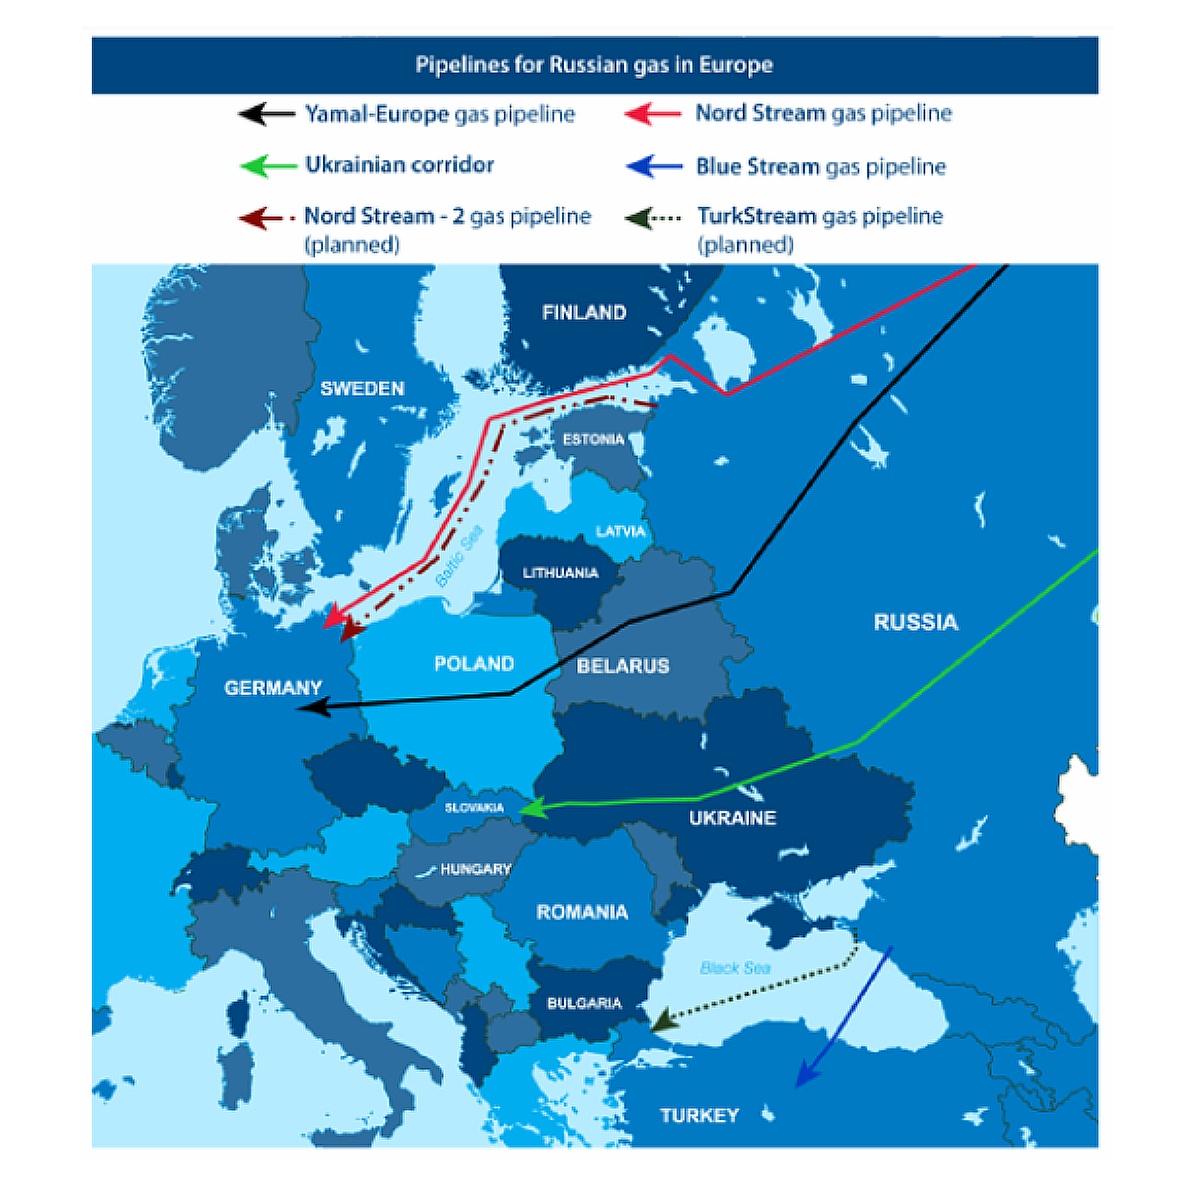 Sources: – Pipeline Diagram from Gazprom. – Oxford Institute of Energy Studies, Russia-Ukraine transit talks: the risks to gas in Europe |
|
The dynamics described in the last sections below means that in 2020, Russia will not be able to do without transport of gas along the Ukrainian route and will therefore need an extension to the existing transit deal with Ukraine which expires at the end of December 2019. As of October 2019, the two sides were far apart, with Russia proposing extending current arrangements for an unspecified period, and the Ukrainians (supported by the EU) demanding a 10 year deal for 60bcm pa. Further complications of the negotiation are:
Given the complexity of the issues, and the poor relationships between the countries, it is quite possible that the sides fail to agree a deal and that supplies along the Ukrainian route are interrupted. In 2018, this route supplied 65bcm of gas to Europe, and in H1 2019 volumes were 36bcm**.
Sources: * Reuters, Financial Times; Flow data from ENTSOG
** Data from DG Energy, EU Commission
Despite the many moving pieces in this complex market, it still is possible to draw some firm conclusions as to where EU gas balances will settle in the next 2-3 years.
The table below shows how the gas supply/demand balance might evolve in 2020, as compared to 2019. In the table, “+” indicates elements that will tighten the balance, and “–” indicates elements that add to oversupply.
| Factor |
Impact on Gas Supply Balance, 2020 vs. 2019 BCM + tightening balance / – loosening balance |
Comments |
| Gas demand in power sector if gas price recovers | Up to -20bcm if gas price returns to mid 2018 levels | See table above. |
| Change in overall power demand | +/- 6 per % total power output | See table above. |
| Change in Renewables Output from Existing Capacity | +/- 11-12 | See table above. |
| Renewables new build/Nuclear Phase Out in Germany | -3 | See table above. |
| Additional LNG Supply | -31 | 45bcm extra supply, less 14bcm growth of demand in non-EU markets. |
| Decline in EU Gas Production | +6 | Around 5bcm for Groningen and 1 in Germany; UK and Norway flat. |
| Change in Russian supply | 0 to +70 | 0 if a supply deal is reached, +70 if supply is interrupted for a full year and alternative routes cannot compensate. |
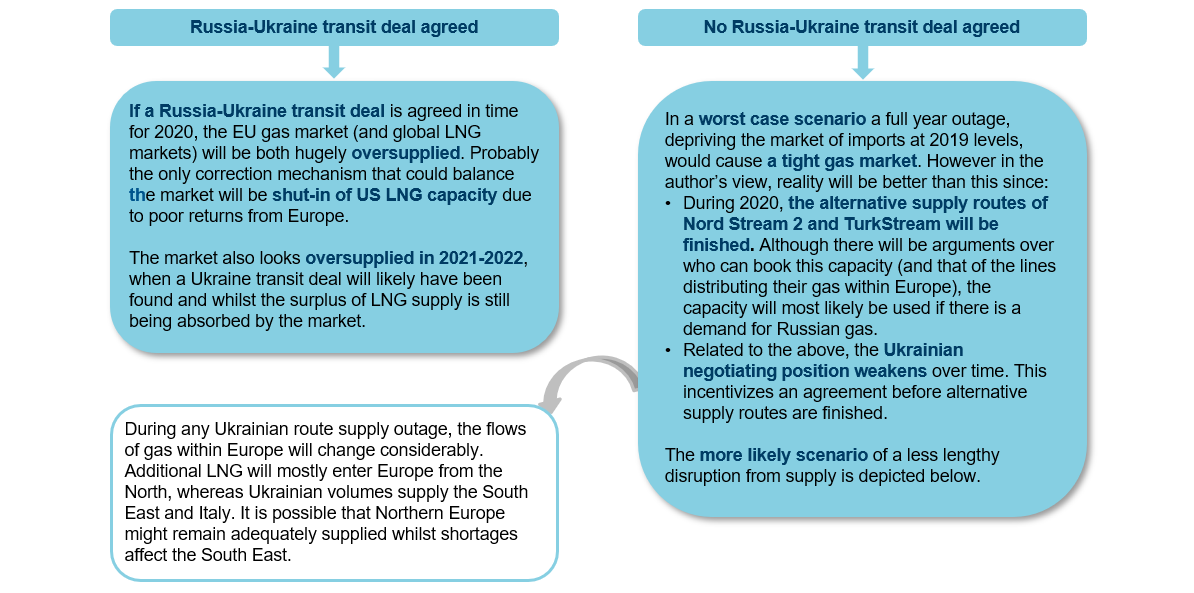
The possible interruption of gas supply through the Ukraine is by far the largest uncertainty hanging over the market. Let us consider two possible outcomes, that a transit deal is reached, and that one is not.
Demand for Gas in the power sector has been one of the key drivers of gas market balances in 2019 and will continue to be important in 2020 and beyond.
Gas demand in the power sector is partly driven by gas price and coal/gas switching, which determines gas’ share of fossil fuel generation, and partly by demand for fossil fuels as a whole – which is in turn driven by overall power demand and renewables/nuclear output.
The EU gas market faces unprecedented uncertainty in 2020, with increased LNG supply, decreasing domestic production, and the possibility of an interruption of Russian supply via the Ukraine. The gas price collapsed in 2019, but as a result of these uncertainties, the forward curve forecasts a recovery in 2020.
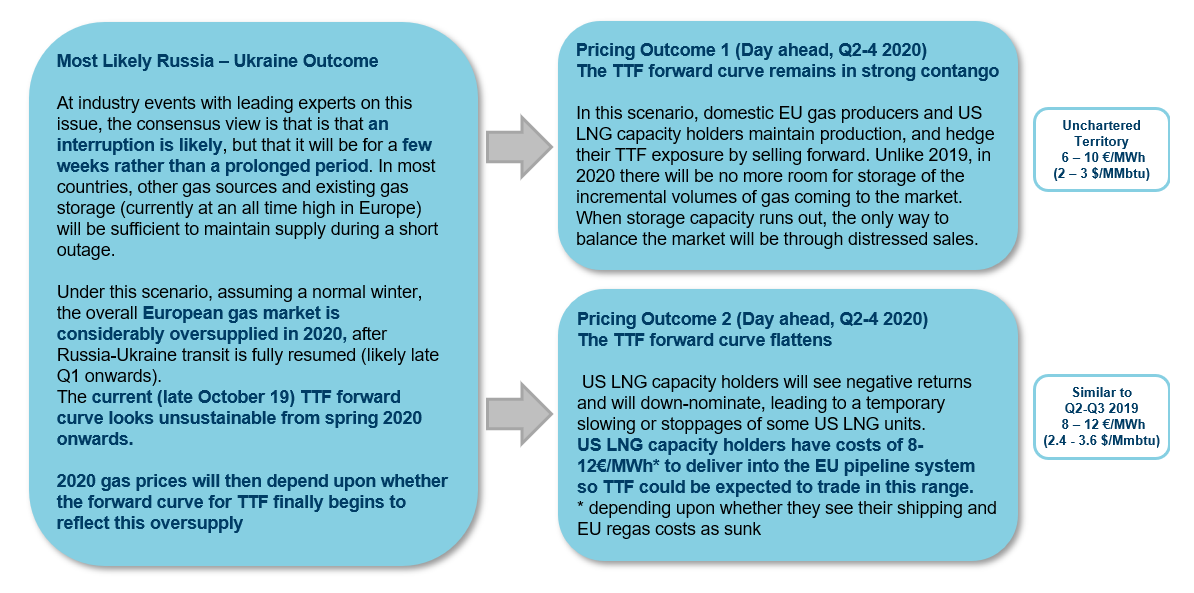
Some interruption of Russia transit via Ukraine is likely. However, should Russia and Ukraine agree terms during Q1 (i.e. an interruption of Ukraine transit of 3 months or less), the gas market will be considerably oversupplied with day-ahead spot prices in the range 2.4-3.6 $/MMbtu.
EU gas prices will remain under pressure in 2020-2022, but could recover sharply in 2023 as new LNG supply decreases and nuclear and lignite retirements increase demand in Germany.
This guide was written by a European Gas Expert – with unique insight into LNG markets, European gas markets and the European power sector, developed over 25 years with an industry-leading international energy company.
Contact Mr Callis on 020 7551 0782 or by email [email protected] to connect with this Expert.